Thursday, March 5, 2015

DNA Restriction Lab

Purpose: The purpose of this lab was to not only understand how gel electrophoresis works,but also learn how to map restriction enzymes a DNA plasmid. Along with this, the lab was also supposed to help us learn about about DNA and how it is cut certain ways based on different variables.


Introduction:
Gel Electrophoresis often used in crime scenes and forscenics in order to compare two different sets of DNA. When the DNA is put into a gel electrophoresis, restriction enzymes are added to the a DNA sample so sciencetists are able to see where the those DNA fragments are compared to the DNA sample of either the criminal or victim. Restriction enzymes tend to cut up DNA into certain sections based on their nucleotide sequences and inside the cell they are usually made to break DNA Apart. In this situation, restriction enzymes are used to cut up a DNA sample to compare to another SNA sample. When adding the different restriction enzymes, you tend to add some idividually and some together with other restriction enzymes. Scientists do this because they want to find every possible way the DNA was spilt up so it can match a certain DNA fragment. 


Procedure:
We pipetted samples of DNA cut with various restriction enzymes into the grooves of a gel. We put the gel into a machine that runs an electric current through the gel, because DNA is negatively charged and will move towards the positive end. We stopped the electric current after 45 minutes to prevent DNA from running off the gel. Larger fragments do not travel as far in the gel because they cannot fit as easily through the pores in the gel.

Here is what the gel looked like before the electri current (sorry for the glare).

Here is what all the gels looked like after the electric current. Our gel is the middle gel in the bottom row.

After using the light and a marker, we made distinct lines of where the gels landed after the electric current.


Discussion: The results we got showed that restriction enzymes cut the DNA in a way so that many pieces of the DNA were the same as the model, showing that the negative DNA flowed properly from the negative pole of the gel to the positive side. In order to map the size of each fragment on the plasmid, we compare the length of the three lanes to the marker to understand roughly how many cuts and where the DNA underwent. Using PstI first, we saw that it had two fragments around 600 and 3300, and PSTI/ SSPI had three fragments at 600, 1500, and 1800. This means that the 600 length piece of DNA was never cut with the SSPI restriction enzyme, so it must have cut the longer piece of DNA into two, one slightly larger than the other. Similarly, the PSI/ HBAI gel cut the longer piece of DNA into two pieces, one much longer (at around 3000) and much shorter (around 300). Our gel was not as clear as other gels, so experimental error is at play in that certain lanes of the gel were not filled as much DNA as others. If all the lanes had an adequate amount of DNA, we might have been able to see our results more clearly. 


Conclusion: we successfully learned how restriction enzymes work and mapping the restriction enzymes on a piece of circular DNA. By loading gel and seeing where the restriction enzymes had cut, we can compare the effects of certain restriction enzymes and use them to compare the similarities in DNA. 

P-Glow E. Coli Lab


Introduction: The transformation of DNA is practice that many biologists use in order to have the bacteria expressed a trait it otherwise would not express. In order to do this, foreign DNA in a circular plasmid form must be added to the bacterial cell. Once there, the mechanisms of the cell are used to translate these genes into proteins that express the genes that were just added to the cell. The plates we are using gave agar, which is a nutrient rich medium that the bacteria thrives in under normal growing conditions. Ampicillin is an antibiotic that normally stops the bacterial cells from living and reducing properly. Arabinose is a sugar that bacteria use as a food source. 


Purpose: The purpose of this lab is to see if E. coli bacteria can successfully be transformed with a recombinant PGLO gene. If successful, the plates that were transformed will be antibiotic resistant as well as glow in the dark. 


Procedures: First we took two micro-test tubes, label them either +pGLO or -pGLO, added 250 micro-liters of transformation solution (CaCl2) to both containers, and placed the test tubes on ice. The using two different sterile loops, we added bacteria (E. Coli) to the loop and added it to the transformation solution to both micro-test tubes. After that, we took on sterile loop full of pGLO plasmid DNA (this glows a turquoise color when under a UV light) and added it to the +pGLO micro-test tube only. Then for ten minutes we let the micro-test tubes sit on the ice for ten minutes.

After the ten minutes we put both the +pGLO and -pGLO micro-test tubes in a water bath that was at 42 degrees Celcuis for exactly 50 seconds, and immediately put the micro-test tubes back on the ice.
After waiting two more minutes, we added LB nutrient brother to both of the micro-test tubes. After mixing the solution we put Exactly 100 micro-liters of either +pGLO to the plates labeled LB /amp and LB/amp/ara and -pGLO to the plates LB and LB/amp. (The LB means that any bacteria will grow, LB/amp means that only plasmid can grow, and LB/amp/ara means that arabinose can be used by pGLO genes to make a fluorescent protein) by using a sterile loop we spread the bacteria around the agar plate and then let the plates sit in an incubator (37 degrees C) for a day.
Adding the bacteria to the micro-test tube.

This is Kat adding the pGLO DNA plasmid to the +pGLO micro-test tube. This was very difficult to do.


The Colored containers in the turquoise Styrofoam are the micro-test tubes sitting on ice.
This is the micro-test tubes sitting in the cold water bath. 
This is spreading the bacteria on the agar plate.

Data:
Here is a data table of what each of the plates looked like after sitting in the incubator.


Here is a picture of a -pGLO LB/amp plate. There is no glow as well as there is no bacteria growth.

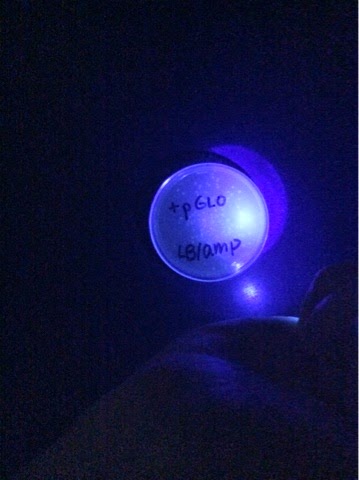
Here is a picture of the +pGLO LB/amp. There is no glow despite the fact that their was bacteria growth.
Here is a picture of the +pGLO LB/amp/ara plates. In this plate there is growth and it can glow under the UV light.

Analysis: Some observations we made about the amount of bacteria growth were that less bacteria grew on the plates containing ampicillin, despite the fact that we used the bacteria that contained the pGlo plasmid. Tis leads us to believe that not all of the bacteria were transformed, because there was much less growth compared to the control group of bacteria on the LB plate. We knew we were able to transform some of the bacteria, because there was no growth on the Amp plate when the bacteria did not have the plasmid, and when the bacteria did contain plasmid, there was some growth. Also, we knew they were successfully transformed because the bacteria did not glow in the dark when they did not have the plasmid.


Conclusion: We were able to successfully transform baceria using the pGlo plasmid, to make it resistant to ampicillin and to glow under UV light.

Monday, February 16, 2015

How to Extract DNA from a Strawberry


1. First we put the strawberry and a buffer in a plastic bag a squished it until it look like pulp (like the picture below).
2. Next we put the pulp into the funnel in order to only the liquid part of the pulp.
3. After there was enough of the liquid in the test tube, we put chilled alcohol into the test tube.

 4. Then, we let the alcohol sit for a couple minutes and eventually we could see the DNA floating around on top of the original liquid. The DNA looked very white and was just resting in the liquid. Below is a before and after picture of how the liquid looked before and after then alcohol had been in the liquid for awhile.


5. After the DNA began to show in the liquid, we were able to extract the DNA out of the liquid using a special tool. Below is a picture of the DNA we extracted.


Wednesday, January 7, 2015

Cell Communications Lab

Purpose:the purpose of this lab was to observe cell communication by measuring reproduction of yeast cells, which reproduce as a result of cell signaling. In this situation, the yeast signaled cells with the correct receptor protiens so the cells could reproduce with them. This was an example about how cell signaling is neccesary for the continuation of life.


Introducion: When only one type of yeast cell is present, either alpha-type or a-type, the yeast will reproduce asexually. However, in a mixed culture, the yeast will signal the other type with pheremones, which the other type have receptors for. This signals the yeast cells to grow towards each other, forming shmoos, and when they meet they reproduce. We measured the amount of cell communitcation happening by counting the shmoos in an area after a partictular amount of time.


Methods and Producers: 
In this experiment, we used had three different yeast samples: a-type, alpha-type, and mixed (a combination of a-type and alpha-type). After collecting each from an original culture, we put them in both agar plates and our own culture tubes. In the culture tubes, there was 2 mL of water along with a small clump of yeast. In the agar plates, there was 5 drops of yeast suspension (also know as yeast food). After doing both of this, we would take a forcep to put some of the yeast cells onto a coverslip, so we were able to see the different types of cells that were in the yeast. We first took a reading of the yeast immediately after putting the cells in the agar plates to find single haploid and budding haploid cells in the a- and alpha-types as well as single haploid and budding haploid cells, shmoos, and zygotes. After reading the yeast cells once, we put them into an incubator overnight so they yeast cells could mate and grow more. The next morning we again put bits of the yeast in a coverslip to see if there was difference in a moment of cells there were. When looking at cover slips, we also looked at many different fields of view in one coverslip, by changing where we were looking on the coverslip.


These are the agar dishes we put each of the yeast cells in to measure the different cells.


Here is the what the mixed culture looks inside of the microscope. Labeled is a budding haploid, and single haploid cell, a shmoo, and a budding zygote. 


After we finished the lab, we had to kill all of the yeast so it would not spread throughout the school. It was a sad ceremony, but they now live in peace.


The data for the a-type culture.


The alpha-type culture data.


The data for the mixed culture.

Discussion:
The data shows that shmoos would only form in the mixed agar plates and liquid culture, because alpha type and a type can sexually reproduce with one another. In general, the count for haploid, diploid, and shmoo for withon from the earlier time to the later time went up after incubating overnight. Since there were no shmoos forming in alpha or a type, alpha type yeast only has the receptor proteins needed for sexual reproduction and shmoo formation for a type, and vice versa. The incubation helps accelerates growth because the warmth was an ideal environment to grow. As tine passed, more signal could sent from one cell to another, pulling them together and causing the proliferation of yeast cells. Cell communication with pheromones There were problems with data collection and counting the number of yeast cells accurately, so if we were to do this again we would have made it more precise.  


Conclusion:
Because no shmoos formed in a non-mixed culture, the conclusion we can make is that the correct receptor proteins must be present, in order to recieve the signal and begin a response. An increase in time also increased the amount of reproduction occurring. Time allowed more signals to be sent, and more responses to be undergone. 

Thursday, December 11, 2014

Photosynthesis Lab

Purpose:
The purpose of this experiment was to test and see if both light and chloroplasts were needed in order for photosynthesis to occur. The Independent variable was how long the the solution had been placed in a light or dark environment with boiled or unboiled chloroplasts. The dependent variable was the amount of transmitance (or light let through) the solution had. 

Introduction:
Before testing with chloroplasts, we used solutions with dye and water to determine absorb acne and transmitance rates using a colorimeter. To make different solutions we started off by putting 2.5 mL of dye solution and 2.5 mL of water in one test tube and then testing it with the colorimeter. Next we would take 2.5 of that original solution and adding 2.5 mL of water, which would make an ever more diluted solution. We did this many more times to insure the solution was very diluted. After looking at the different results of the data using the colorimeter, we found that as the more diluted the solution is the lower the absorbance rate and the higher the transmitance rate. With this in mind, one can see that the easier light can go through the solution, the higher transmitance rate.


Putting the different solutions in the cuvette in the colorimeter to test the absorbance and transmitance of different dilutions.


This is data from the colorimeter say the percent of the orginal solution in the tested solution, the transmitance, and the absorbance.


Procedures, Graphs, and Charts:
     In order to find out how leaf pigments absorbed light, we mixed solutions is boiled (dead) and unboiled (alive) chloroplast along with other solutions (such as water, a phosphate buffer, and DPIP(increases light transmitance). We again used a colorimeter to find out if light and chloroplasts are both needed for photosynthesis. After mixing the different solutions we set them in front of a light and a beaker of water, so that we could see how the chloroplasts absorbed the light. One cuvette(the one wrapped in tin foil) was supposed to be not absorb light since it is the control.


Here is a picture of how we put each cuvette in front of the light.

We first tested each of the cuvettes in the colorimeter, to test transmitance and absorbance, before we put them in front of the light and then again after sitting in the light for 5, 10, and 15 minutes.


Here is the data taken from the colorimeter based upon what type of chloroplast it had, if it was in the light or dark, and how long the cuvette was in the light.


 Results: After looking at the different results of the data using the colorimeter, we found that as the more diluted the solution is the lower the absorbance rate and the higher the transmitance rate. With this in mind, one can see that the easier light can go through the solution, the higher transmitance rate. Because DPIP turns from blue to clear when it is reduced by chloroplasts, the longer and therefore more pale the solution was, the higher the transmitance was. Since the transmitance was higher, more light could get through the solution and the light reactions of photosynthesis could occur from excited electrons from light. This is because the clearer liquid has no pigments for the light to be absorbed in, it can pass through. In order to make sure that the DPIP had a role in this, we made a control group with no DPIP, and photosynthesis did not occur. In general, we had trouble controlling data and storing it in the lab equipment, so some of the data points were lost. For the data points we were able to recover, the the direct relationship between time and percent transmitance is present as we hypthesized. Also, the unboiled chloroplasts were unable to photosynthesize in our exoeriment, which can be explained by the denaturing of crucial proteins needed to in photosynthesis. This experiment could have been more accurate if we had more data to back up our results.

Conclusion: After looking at the results, one can tell that the amount of light transmitted and the presence of chloroplasts both have crucial roles in the photosynthesis. 


Wednesday, December 3, 2014

Enzyme Lab

Purpose: The purpose of this experiment was to find how much of the hydrogen peroxide decomposes depending how how long the enzyme was able to react with the catalase extract. In shorter terms, we trying to figure out how much product an enzyme could make during a certain time period. 

Introduction: Enzymes, which are made out if proteins, speed up chemical reactions inside a cell; another word to describe an enzyme is a cataylst. When a substrate is added to this enzyme-catalyzed reaction, the energy needed for the reaction to occur is reduced. At any point in a reaction an enzyme-catalyzed reaction could stop if there is a change in pH, temperature, or salt concentration. Sometimes the enzyme-catalyzed reactions can be completed changed due to activators or inhibitors which can change the shape of the enzyme or block certain substrates of going into the active site. 

Methods, Charts, and Graphs: in order to have a baseline of how much unreacted hydrogen peroxide is in 5 mL of  1.5% Hydrogen peroxide, we put 5 ml of unreacted hydrogen peroxide in a cup and titrated it with KMnO4. For the baseline, 3.6 mL of KMnO4 were used. To find how much Hydrogen peroxide is catalyzed over different periods of time, we added yeast, which contains catalase, into the hydrogen peroxide, and let it react for specific times. After he time was up, we added sulfuric acid to denature the enzyme, stopping the reaction. We then took 5 mL of the catalyzed hydrogen peroxide, and titrated it with KMnO4 to see how much hydrogen peroxide was left. We subtracted that number from the baseline to find how much hydrogen peroxide was broken down by the catalase.


Here is the data table that shows how much KMnO2 is consume and H2O2 is used.


Here is a graph showing the amount of H2O2 is used up over time.


Discussion Questions:
     The rate of reaction is highest for the longest time period, 360 seconds, because the catalase has had more time to break apart the H2O2. The lowest rate was the lowest time period, because it hadn't had as much time to react. We stopped the reaction with H2SO4, an acid that denatured the catalase, and as a result, it could no longer break apart the H2O2. Lowering the temperature would also inhibit the reaction, as temperature changes can also denature an enzyme. Enzymes have an optimal pH and temperature, and under these conditions the rate of reaction is highest. An experiment to determine this would be to measure the rate of reaction with the time and temperature held constant, at different pH, and again with time and pH held constant, at different temperatures.


This shows how the pH of an enzyme relates to how efficient proteins can function.